



Table Of Contents
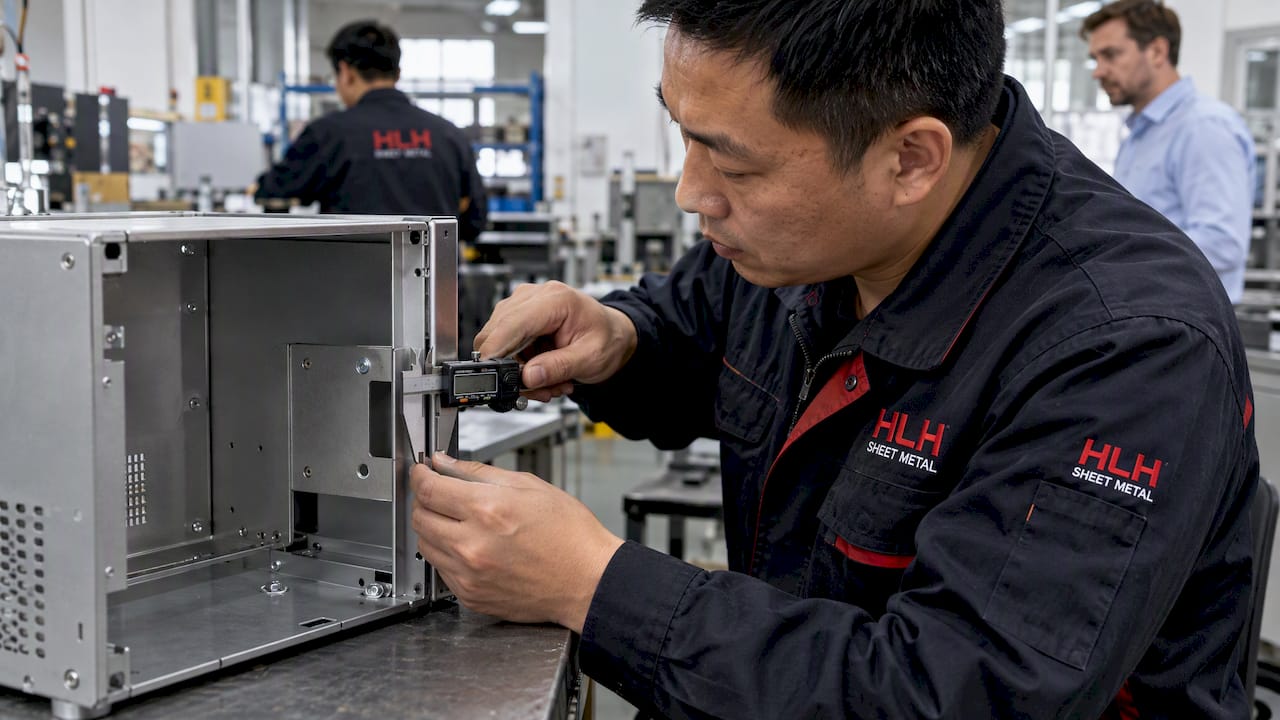
A tolerance stack up predicts how the individual tolerances on mating parts combine to affect a final assembly dimension or fit. Use worst-case arithmetic stacking when every unit must function, including safety-critical or zero-defect interfaces, use root-sum-square (RSS) when contributing processes are independent and centered, and reserve Monte Carlo simulation for nonlinear, correlated, or 3D problems. Both ASME Y14.5 and NIST guidance anchor these methods in practice.
TL;DR:
- Worst-case stacking guarantees functional assembly in all possible tolerance extremes but tends to produce overly tight and costly tolerances for long chains.
- Root-sum-square stacking provides a more realistic tolerance estimate under the assumption of independent, centered process variations, but can be optimistic if those assumptions do not hold.
- Hybrid methods that add mean shifts to RSS account for known process offsets, offering a balance between conservatism and realism in tolerance analysis.
- Monte Carlo simulation is necessary for nonlinear, 3D, or correlated assembly problems, but requires accurate input modeling and validation to be reliable.
- Regularly re-evaluate the tolerance stack-up after process or design changes, and prioritize sensitivity analysis to focus on contributors that significantly impact assembly variation.
What A Tolerance Stack Up Actually Measures
A tolerance stack up answers one functional question: given the allowed variation on each part in a chain, what is the range of the resulting assembly dimension? That resulting dimension might be a gap, an interference, a hole alignment, or a clearance between a bracket and a housing wall. The calculation only matters if it ties back to a functional requirement, so the first job in any stack is identifying which dimension the design actually needs to control.
Every contributor in the chain gets a nominal value, a tolerance, and a sign that reflects whether it adds to or subtracts from the resulting dimension. Signed, algebraic stacks are the default for 1D dimension chains: you walk the chain from one end to the other, assigning a positive or negative sign to each contributor based on its direction relative to the measurement you are solving for. Unsigned stacks, where you simply add tolerance magnitudes without direction, are reserved for quick bounding checks and are rarely adequate for a documented engineering release.
Datums matter as much as the dimensions themselves. A feature’s tolerance means nothing without a clear reference frame, and ASME Y14.5 sets the symbols, datum precedence rules, and composite position tolerance conventions that determine how a measured feature relates to the rest of the part. A linear dimension stack and a geometric tolerance stack are not interchangeable: position tolerances on a feature of size apply within a tolerance zone that can be circular, cylindrical, or otherwise non-linear, and converting that zone into an equivalent linear allowance requires care, particularly at maximum material condition.
Most engineers start with a 1D dimension-chain model because it is fast and transparent, but many real assemblies are not 1D problems. A bracket that locates in two planes, or a connector that must align in X, Y, and rotation simultaneously, needs a geometry-aware model that accounts for multiple degrees of freedom and their interactions. Treating a 3D fit problem as a simple linear chain understates risk because it ignores how tolerance zones combine across axes.
Before running any calculation, confirm you have:
- The functional requirement and which resulting dimension controls it.
- Every contributor’s nominal value, tolerance, and direction of influence.
- The datum scheme and whether features are controlled by GD&T or plus/minus dimensions.
- Whether the problem is genuinely 1D or needs a 3D or nonlinear treatment.
Worst Case, RSS, And Monte Carlo Compared
Three methods cover almost every tolerance stack an engineer will run, and each rests on a different assumption about how parts actually vary.
Worst-case (arithmetic) stacking assumes every part can land anywhere inside its tolerance band, including simultaneously at the worst possible combination of limits. Scholz’s tolerance stacking review defines the method as placing every contributor at its adverse limit: the upper worst-case limit, TWC+, sums all upper contributions, and the lower worst-case limit, TWC−, sums all lower contributions. The tradeoff is that worst-case tolerances shrink fast as chains get longer, often forcing tolerances on individual parts that are tighter, and therefore more expensive, than the real-world risk justifies.
RSS stacking takes the opposite view: if each contributor’s variation is independent and centered on its nominal, the probability that all of them land at their limits simultaneously is vanishingly small. The method sums variances instead of tolerances directly. For contributors with tolerance values T1 through Tn, the basic RSS equation is:
T(RSS) = square root of (T1² + T2² + … + Tn²)
This produces a narrower, more realistic assembly tolerance than worst-case, but Scholz is explicit that the independence and centering assumptions have to be documented, not assumed. A process with a shifted mean, from tool wear or a deliberate offset toward maximum material condition, breaks the centering assumption and makes plain RSS optimistic.
That is where hybrid methods come in. When mean shifts are likely, Scholz and the related NISTIR 6223 report describe stacking the mean shifts arithmetically and the residual part-to-part variability statistically. This produces a result that is more conservative than pure RSS but less pessimistic than pure worst-case, and it ties naturally into process capability: a process with a known Cpk below 1.33 is a candidate for an inflation factor on its RSS contribution, since its real spread is wider than its nominal tolerance band alone would suggest.
Monte Carlo simulation handles the cases where the algebra gets messy: nonlinear assembly functions, correlated inputs, non-normal or truncated distributions, or full 3D stacks with multiple interacting degrees of freedom. NIST’s Monte Carlo guidance describes the method as repeated sampling from each input’s specified distribution, followed by evaluation of the assembly model and statistical analysis of the output distribution. Its strength is flexibility; its risk is that the simulation is only as good as the model and the input distributions you feed it. A 2020 NIST notice on uncertainty tools is blunt about this: Monte Carlo cannot fix a poor model, and incorrect distributions or omitted correlations produce misleading results even with thousands of samples.
A few less common variants round out the toolkit. Extended Taylor series methods linearize a nonlinear assembly function around its nominal point and propagate variance through the partial derivatives, useful when a full Monte Carlo run is overkill but a simple RSS misses curvature. Quadrature-based methods evaluate the assembly function at a small set of strategically chosen points instead of thousands of random samples, trading some accuracy for speed.
| Method | Core assumption | Best fit | Main limitation |
|---|---|---|---|
| Worst case | All contributors at adverse limits simultaneously | Safety-critical, zero-defect interfaces | Tolerances shrink fast on long chains |
| RSS | Independent, centered distributions | Independent processes, no known mean shift | Optimistic if centering or independence fails |
| RSS with inflation or mean-shift stacking | Known mean shift plus residual variability | Processes with documented Cpk or known offset | Requires solid process capability data |
| Monte Carlo | Model and distributions are known and valid | Nonlinear, correlated, or 3D stacks | Only as credible as the input model |
A Worked Example: Calculating Worst-case And RSS By Hand
Say a sheet-metal enclosure assembly needs a clearance gap between a mounting bracket and an internal chassis wall, and that gap is the functional dimension you are solving for. The chain has four contributors, each measured from the same datum direction.
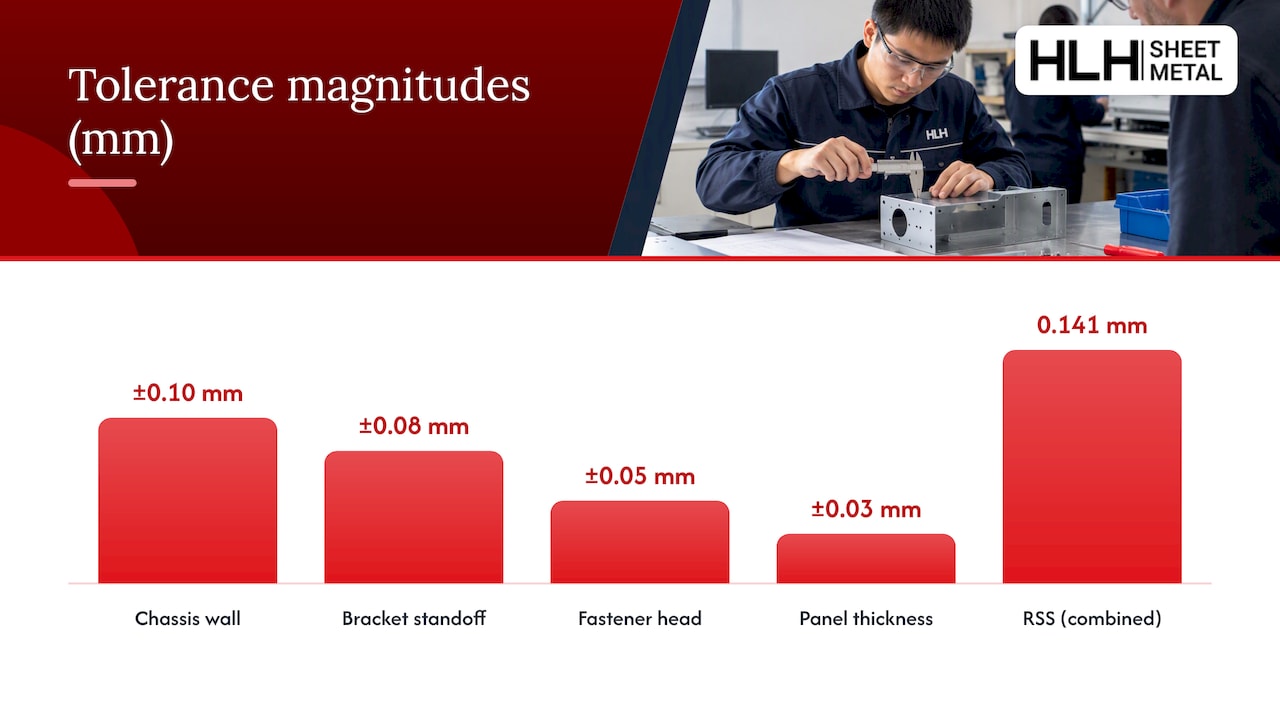
- Chassis wall position: nominal 50.00 mm, tolerance ±0.10 mm, positive contribution.
- Bracket standoff length: nominal 30.00 mm, tolerance ±0.08 mm, negative contribution.
- Fastener head height: nominal 5.00 mm, tolerance ±0.05 mm, negative contribution.
- Panel thickness: nominal 2.00 mm, tolerance ±0.03 mm, negative contribution.
The nominal gap is the algebraic sum: 50.00 − 30.00 − 5.00 − 2.00 = 13.00 mm.
For the worst-case limits, every contributor moves to its adverse extreme simultaneously. TWC+ (maximum gap) uses the chassis wall at its upper limit and the subtracted contributors at their lower limits: 50.10 − 29.92 − 4.95 − 1.97 = 13.26 mm. TWC− (minimum gap) reverses this: 49.90 − 30.08 − 5.05 − 2.03 = 12.74 mm. So the worst-case gap ranges from 12.74 mm to 13.26 mm, a total spread of 0.52 mm, which also equals the simple sum of all four tolerance magnitudes (0.10 + 0.08 + 0.05 + 0.03 = 0.26 mm on each side).
For RSS, apply the formula from the method comparison above to the same four tolerances:
T(RSS) = square root of (0.10² + 0.08² + 0.05² + 0.03²) = square root of (0.0100 + 0.0064 + 0.0025 + 0.0009) = square root of 0.0198 ≈ 0.141 mm
The worst-case spread is noticeably wider than the RSS spread for the identical set of contributors, a gap that shows up repeatedly when worst-case and RSS stacking are compared on the same chain. That difference is the practical cost of the worst-case assumption: it guarantees every unit functions, but it does so by budgeting for a combination of extremes that, under independent and centered assumptions, is statistically unlikely to occur in any single assembly.
If the fastener process is known to run with a mean shift, say the fastener heads tend to land 0.02 mm high due to seating variation, that shift gets added arithmetically to the RSS result rather than folded into the variance term, giving a hybrid tolerance that is wider than pure RSS but still narrower than full worst-case.
Choosing A Method Fast: A Decision Checklist
Picking the right method before you touch a spreadsheet saves rework later. Run through these questions in order.
- Does every unit need to function with zero failures, such as a safety interlock or a medical device housing? Use worst-case.
- Are the contributing processes independent, with no known mean shift, and is the assembly not safety-critical? RSS is appropriate.
- Is there a documented mean shift, tool wear pattern, or deliberate MMC offset in any contributor? Use RSS with an inflation factor or mean-shift stacking.
- Is the assembly function nonlinear, are inputs correlated, or does the stack involve three-dimensional alignment rather than a single linear chain? Move to Monte Carlo.
Each method also has a minimum data requirement. Worst-case needs only nominal values, tolerances, and direction. RSS additionally needs confidence that each contributor’s distribution is roughly centered and independent of the others. Mean-shift hybrids need process capability data, typically Cp and Cpk from the actual production process, not just the drawing tolerance. Monte Carlo needs full distribution shapes for every input, documented correlations between inputs where they exist, and a validated assembly model, since the NIST Monte Carlo tool and the broader NIST Uncertainty Machine framework both depend on accurate input specification to produce a trustworthy output distribution.
Before trusting any statistical result, record the assumptions behind it: which distributions were assumed, what capability data supported them, where correlation estimates came from, and whether the model was validated against any physical measurement. A result without that documentation is not reproducible, and a reviewer has no way to judge whether it is conservative or optimistic.
Pro Tip: Run the worst-case number first even when you plan to use RSS. If the worst-case result already passes, you may not need the statistical analysis at all.
Allocating Tolerances Where They Actually Matter
Not every contributor in a stack deserves the same attention, and sensitivity analysis is how you find out which ones do. Differentiate the assembly equation with respect to each contributor, or simply perturb one contributor at a time in a spreadsheet model, and rank the contributors by how much the output gap moves per unit of input change. In the enclosure example above, the chassis wall position and bracket standoff carry more weight than the fastener head or panel thickness simply because their tolerances are larger, but in a more complex geometric stack a small-tolerance feature can still dominate if its sensitivity coefficient is high.
Design for Tolerance (DFT) practices push this thinking earlier in the design cycle rather than leaving it for a late-stage tolerance review. NISTIR 6524 frames tolerancing as an iterative synthesis problem: pick nominal values and tolerance bands together, run the sensitivity check, adjust, and repeat, rather than fixing nominals first and treating tolerances as an afterthought. This matters because tightening a tolerance after tooling exists is far more expensive than allocating it correctly during initial sheet metal DFM review.
Process capability data should drive where tolerance budget goes. A contributor from a process with Cpk near or below 1.0 is running close to its specification limits already, and tightening its drawing tolerance without improving the process will just increase scrap. A contributor from a process with high Cpk has margin, and loosening its tolerance to free up budget elsewhere is often the cheaper move. This is also where inflation factors earn their place: apply one to any contributor whose real-world capability is weaker than its drawing tolerance implies.
A few practical moves make tolerance allocation stick:
- Rank contributors by sensitivity before deciding which to tighten.
- Check Cp/Cpk for any process before assuming its tolerance band reflects real variation.
- Align datum schemes with how the part will actually be measured in inspection, not just how it is dimensioned on the drawing.
- Revisit the stack whenever a process, supplier, or fixture changes, since the original capability assumptions may no longer hold.
Inspection strategy and datum strategy are two sides of the same coin. If a feature is toughest to measure the way it was dimensioned, it will be measured inconsistently on the shop floor, which quietly widens the real tolerance regardless of what the drawing says. A documented quality control plan that ties inspection points to the same datum scheme used in the stack-up keeps the analysis honest.
Where Rigid 1d Stacks Break Down
A 1D arithmetic or RSS stack treats every part as a rigid body that holds its as-measured dimension once assembled. Real assemblies rarely cooperate. Stiffness, contact between mating surfaces, and the order in which parts are joined all change the functional result compared to the free-state dimensions the stack assumed.
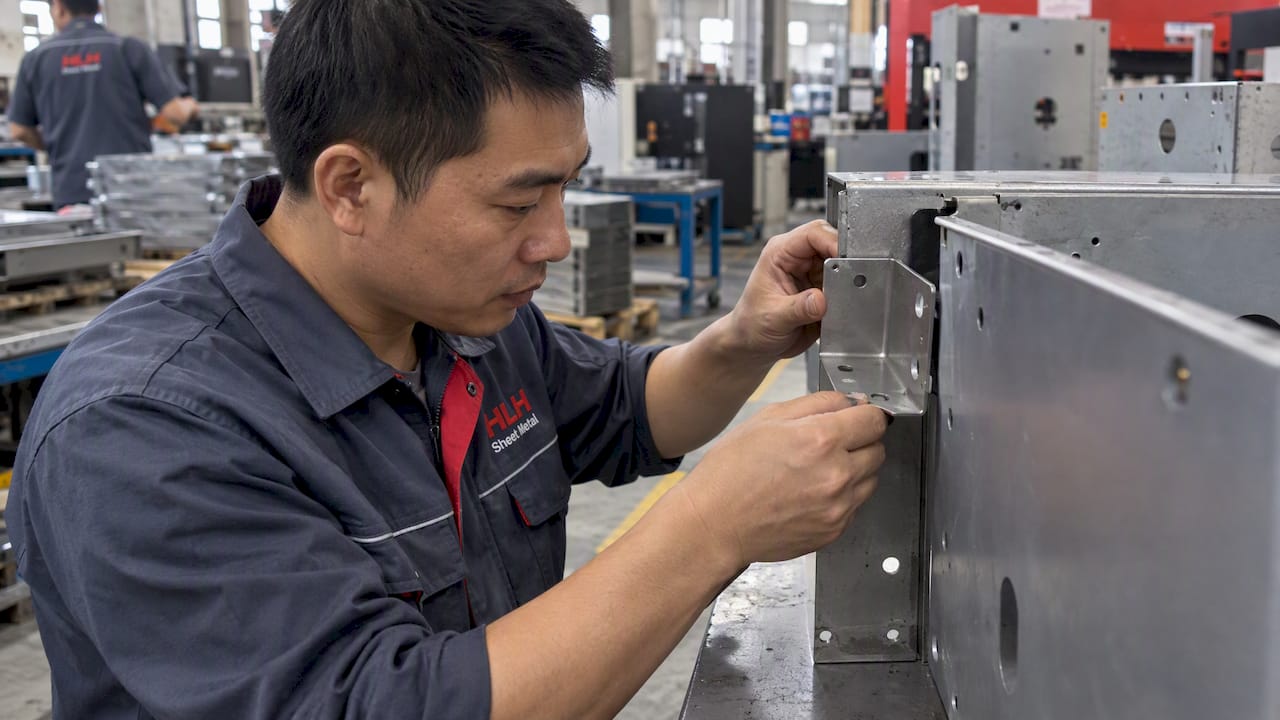
Sheet metal assemblies are a common place this shows up. Springback after forming means a part’s free-state angle or radius can differ from its as-designed value, and clamping during welding or fastening can distort a panel into a shape that only matches the drawing once the clamps come off. Scholz’s review and later research both note that free-state measurements can materially misrepresent the constrained, assembled condition, which is exactly why a stack built entirely from free-state dimensions can pass on paper and still fail on the bench.
A few signals suggest it is time to escalate beyond a 1D stack:
- The assembly involves compliant or thin-wall parts where clamping or welding sequence visibly changes shape.
- Multiple features must align simultaneously in more than one plane, suggesting a true 3D fit problem.
- Contact forces or fastener preload could change the resting position of a part relative to its unconstrained dimension.
When any of these apply, a finite element check of the constrained assembly, or a physical fixturing study on a prototype, is a more reliable guide than extending the 1D arithmetic further. Laser-cut parts and stamped parts each carry their own process-specific variation that a purely geometric stack will not capture on its own.
From Spreadsheet To Simulation: Picking The Right Tool
A spreadsheet is enough for most 1D worst-case and RSS stacks. Structure it with one row per contributor, columns for nominal, tolerance, sign, and sensitivity coefficient, and a summary row that computes both the arithmetic and RSS totals side by side so you can see the gap between them immediately.
Moving to Monte Carlo only makes sense once the spreadsheet model is trustworthy. Before picking a Monte Carlo tool, confirm it lets you specify a distribution shape per input rather than forcing a normal distribution on everything, handle correlations between inputs where they exist, and report enough of the output distribution to judge yield against a specification limit. The NIST Uncertainty Machine is a solid reference implementation for this kind of uncertainty budget, supporting multiple input distributions and correlated inputs while reporting standard and expanded uncertainties.
A practical workflow for most mechanical assemblies:
- Define the assembly model and confirm the functional dimension it solves for.
- Run the arithmetic worst-case as a sanity check, even if you expect to use RSS.
- Run RSS for the documented, independent, centered case.
- Validate any part flagged as high-sensitivity or safety-relevant with a Monte Carlo simulation before release.
Why I Push Teams To Treat Stack-ups As A Living Document
The biggest mistake I see is treating a tolerance stack as a one-time calculation that gets filed away after the design review. Processes drift, suppliers change, and a Cpk number that was true during prototyping is not guaranteed to hold once a part moves to a different plant or a different operator. A stack-up that gets re-run after every meaningful process or design change catches problems a static document never will.
The second mistake is skipping the sensitivity check because the worst-case or RSS number already passed. Knowing which one or two contributors actually drive the result is what lets you make a fast, cheap fix later instead of a slow, expensive one. Record your assumptions, including which distributions you picked and why, so the next engineer who touches the assembly is not reverse-engineering your logic from a bare number.
— Nash
How HLH Sheet Metal Supports Toleranced Part Production
Running a tight tolerance stack-up only pays off if the parts coming off the line actually hold the numbers you calculated. They fabricate custom sheet metal parts and assemblies, including server rack enclosures and chassis, across various metals, with quality control built into the production process. Prototyping options let you validate a stack-up against a physical part before committing to a full production run, and manufacturing facilities offer paths from small prototype batches to volume production without switching suppliers mid-project.
For parts where the stack-up points to a specific process, tight-tolerance cutting, controlled bending, or a particular surface finish that affects a functional thickness, HLH’s laser cutting, stamping, bending, and welding services are each built around holding the tolerances those processes are capable of, backed by a support team that works directly with engineering drawings and GD&T callouts.
If you have a tolerance stack-up on a sheet metal assembly and need to know whether a given process can hold it, visit the sheet metal fabrication capabilities page to request a quote and review your tolerance requirements with the team before you commit to tooling.
Sources
These are the primary sources behind the methods and figures in this guide, useful for deeper verification or formal documentation of an assembly’s tolerance analysis.
- Tolerance Stack Analysis Methods (Scholz)
- NIST Monte Carlo Tool / guidance
- NIST Uncertainty Machine
- ASME Y14.5-2018 (Dimensioning and Tolerancing)
FAQ
What Is Meant By Tolerance Stack-up?
Tolerance stack-up is the combined effect of individual part tolerances on a final assembly dimension, such as a gap, alignment, or interference. Engineers calculate it by summing contributors algebraically, using methods like worst-case or RSS stacking, to predict whether an assembly will meet its functional requirement across its expected range of variation.
How Do You Calculate The Tolerance Stacking?
Identify every contributor’s nominal value, tolerance, and sign relative to the dimension you are solving for, then choose a method. Worst-case sums the contributors at their adverse limits to get TWC+ and TWC−, while RSS takes the square root of the sum of squared tolerances, as shown in the worked example above.
What Is RSS Tolerance Stackup?
RSS, or root-sum-square, stacking combines tolerances by summing their squares and taking the square root, rather than adding them directly. It assumes each contributor’s variation is independent and centered on its nominal value, which typically produces a narrower, more realistic assembly tolerance than worst-case stacking on the same chain.
What Are The Different Types Of Tolerance Stack-up Analysis?
The main types are worst-case arithmetic stacking, RSS statistical stacking, hybrid methods that combine mean-shift stacking with RSS, and Monte Carlo simulation for nonlinear, correlated, or three-dimensional problems. Less common variants include extended Taylor series linearization and quadrature-based methods, each trading some accuracy for speed compared to full Monte Carlo simulation.
When Should I Move From RSS To Monte Carlo Analysis?
Move to Monte Carlo when the assembly function is nonlinear, when contributors are correlated rather than independent, or when the stack is a true 3D or multi-axis alignment problem rather than a single linear chain. The NIST Monte Carlo tool is built specifically for these cases, provided the input distributions and correlations are documented accurately.

